NPS tells you how customers feel today. Customer lifetime value tells you what they're worth over time. On their own, each one leaves a gap. Put them together and you can show what a point of NPS is worth in dollars.
What Each Metric Measures
NPS
Net Promoter Score asks how likely customers are to recommend you. It's quick to collect and easy to track. On its own, it says nothing about revenue. It is a leading indicator, though. Scores often drop before customers cancel, which gives you time to act.
CLV
Customer lifetime value estimates the total revenue a customer brings in over their relationship with you, minus the cost to serve them. Finance teams trust it because it's built from real purchase data. The catch is that CLV moves slowly. By the time it drops, the customer may already be gone.
What each metric measures
NPS
- How likely customers are to recommend
- Quick to collect, easy to track
- A leading indicator
- Says nothing about revenue
CLV
- Total revenue minus cost to serve
- Built from real purchase data
- Trusted by finance
- Moves slowly
How the Two Connect
Bain's research on loyalty economics found that in retail banking, a promoter was worth roughly $9,500 more than a detractor. Bain's Rob Markey and Fred Reichheld went further, writing that “detractors have a negative lifetime value.” Your numbers will differ, but the pattern usually holds. The size of the gap is what tells you how much a better experience is worth to your business, so measure it before you set any targets.
Few teams measure the link
A 2026 survey of 600 US CX leaders found that only 19% were measured on CX's impact on customer lifetime value. Most teams report NPS in one meeting and revenue in another. Joining the two gives you a story finance can follow.
- $9,500more a promoter was worth than a detractor, retail bankingSource: Bain
- 19%of CX leaders measured on CX's impact on CLVSource: 2026 survey of 600 US CX leaders
Figures as cited in this article
How to Calculate Feedback Impact
You can build a simple version in a spreadsheet:
- Pull CLV for every customer who answered your NPS survey.
- Group them by NPS category.
- Calculate the average CLV for each group.
- Multiply the gap by the number of customers you could move up a group.
A worked example
Say promoters average $12,000 in CLV and detractors average $4,000. If you move 200 detractors up a group, the value gained could run into the hundreds of thousands. Even a cautious version of that number gets a CFO's attention. Present the low end of your estimate first. If the cautious number still makes the case, nobody can accuse you of overselling. Our guide to proving VoC ROI to the CFO shows how to present it.
Calculating feedback impact
- Pull CLV for respondentsEveryone who answered your NPS survey
- Group by NPS category
- Average CLV per group
- Multiply the gapBy customers you could move up a group
Free review snapshot
See what your customers are saying, before you talk to us.
No commitment. We use your details only to send your snapshot and follow up. Privacy policy
Making the Numbers Trustworthy
Control for customer size
Large accounts may score differently from small ones. Compare customers of similar size so the CLV gap reflects feedback and doesn't just reflect account size.
Track movers over time
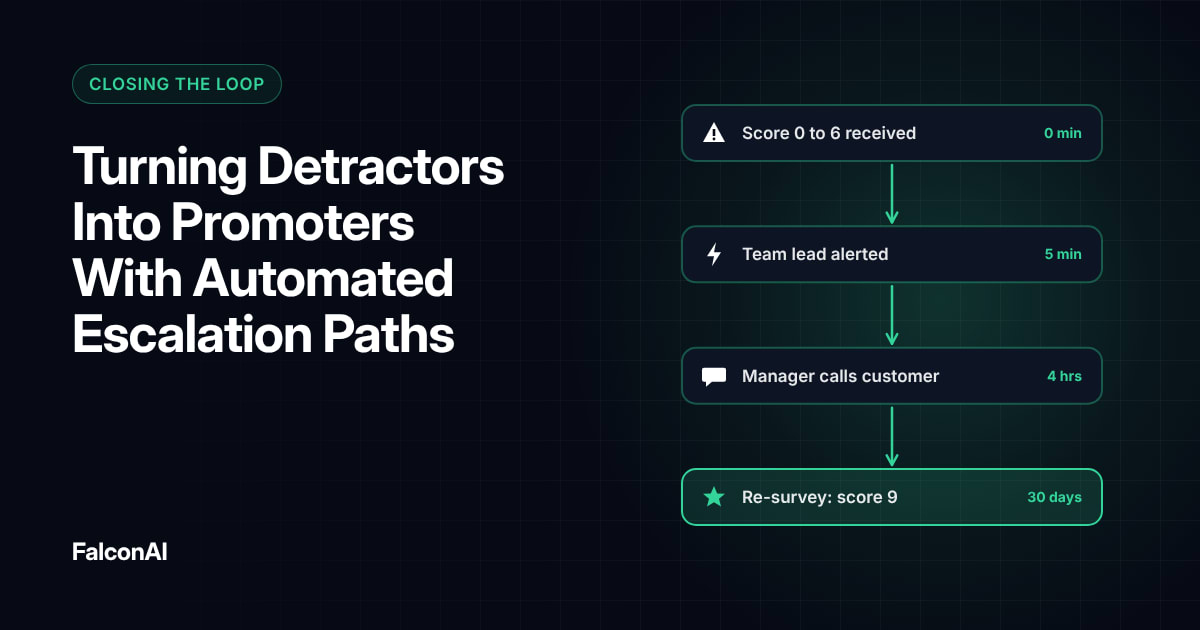
The strongest proof comes from customers who changed groups. If detractors who got a follow-up later became promoters and spent more, that's your evidence. Our post on turning detractors into promoters covers the follow-up side.
Reporting the Result
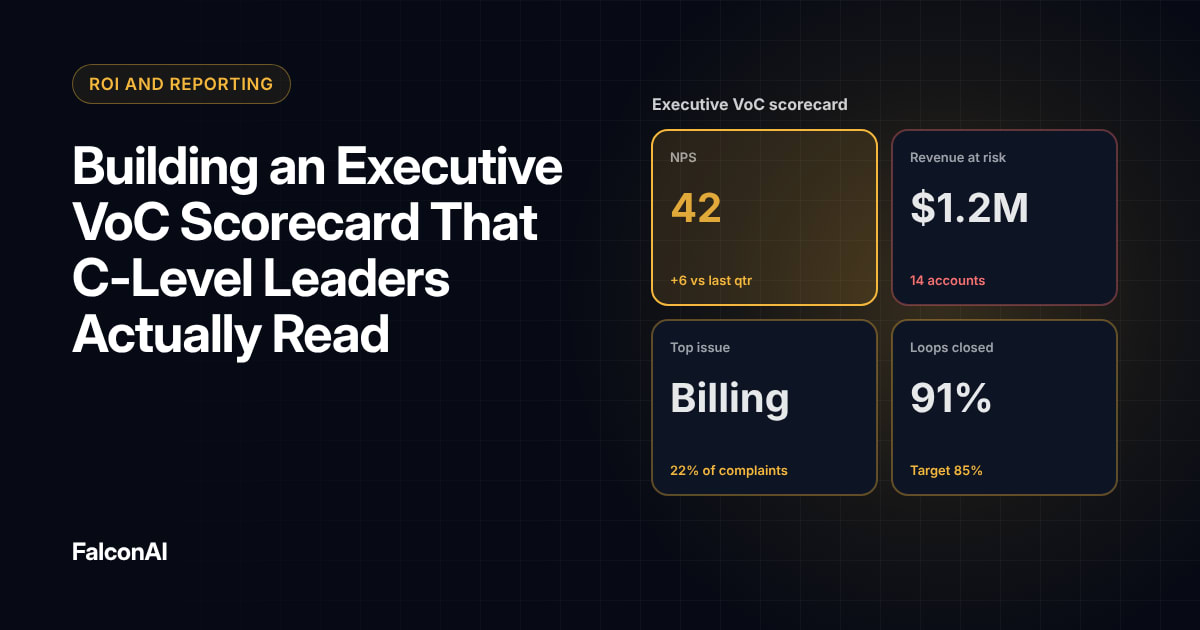
Show CLV by NPS group in your executive VoC scorecard. Leaders understand dollar gaps faster than score changes.
Update it twice a year
CLV changes slowly, so a twice-yearly refresh keeps the trend current without extra work. You can see CLV next to scores in NPS analysis, or book a demo.
Frequently asked questions
What is the difference between CLV and NPS?
NPS measures how likely a customer is to recommend you. CLV measures how much revenue they bring in over time.
Which matters more to finance?
CLV matters more to finance. NPS is useful because it changes before CLV does and points to what to fix.
How do you link NPS to CLV?
Group customers by NPS category and compare their average lifetime value.
Do promoters always have higher CLV?
Usually, but not always. Check your own data and control for customer size.
How often should you update the analysis?
Twice a year is enough for most companies, since CLV changes slowly.
Can small companies do this analysis?
Yes. A spreadsheet with scores and revenue per customer is enough to start.