Your customers keep complaining about the same checkout bug. Product says it's on the roadmap. Finance asks what it's worth to fix. If you can answer that question with a number, the fix moves up the list.
Why Friction Costs More Than You Think
Every friction point has two costs. The first is the support work it creates. The second is the customers it drives away.
The Qualtrics 2025 Consumer Trends Report estimated that $3.8 trillion in global sales was at risk from bad experiences. Metrigy research found that 44.4% of customers leave after an average of 2.4 bad experiences. A friction point that hits many customers adds up fast.
Repeat contacts add up
HubSpot's 2024 State of Service report found that 75% of CX leaders said ticket volume was up. Many of those tickets come from the same few problems, contact after contact. When you count them by theme, a handful of issues often explain a large share of total volume.
- $3.8 trillionin global sales at risk from bad experiencesSource: Qualtrics 2025 Consumer Trends Report
- 44.4%of customers leave after repeated bad experiencesSource: Metrigy
- 75%of CX leaders said ticket volume was upSource: HubSpot 2024 State of Service
Figures as cited in this article
How to Pick the Friction Points to Measure
Start with the themes that come up most in feedback and support tickets. Rank them by:
- The number of customers affected.
- The revenue those customers represent.
- The support contacts each issue creates.
- How often the issue shows up in churned accounts.
Group complaints by cause
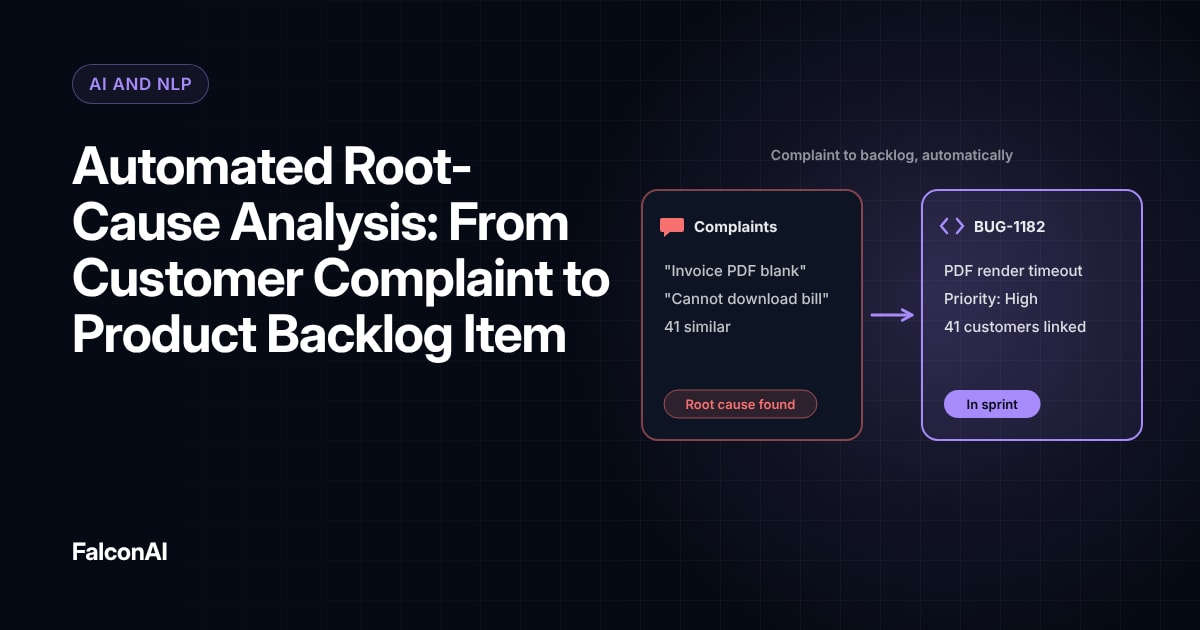
Ten different complaints can trace back to one broken step. Group them before you rank them. If customers can upvote issues in a feedback portal, add those vote counts to your ranking. Our guide to automated root-cause analysis shows how.
Rank friction points by
- Customers affected
- Revenue those customers represent
- Support contacts each issue creates
- Showing up in churned accounts
- Upvotes in a feedback portal
Measuring Before and After
Set a baseline
Before the fix ships, record ticket volume on the issue and the share of negative feedback that mentions it. Add churn among affected customers. Use at least a few months of data so one busy week doesn't skew the picture. Note anything else that changed in the same period, such as a price change, so you don't credit the fix for unrelated gains.
Measure the change and price it
After the fix, track the same numbers over the same length of time. Multiply the drop in tickets by your cost per ticket. Add the revenue from customers who would likely have churned. That total is the financial impact of the fix.
Pricing a fix
- Set a baselineTickets, negative mentions, churn among affected
- Track the same numbers afterOver the same length of time
- Price the ticket dropMultiply by your cost per ticket
- Add revenue keptCustomers who would likely have churned
Free review snapshot
See what your customers are saying, before you talk to us.
No commitment. We use your details only to send your snapshot and follow up. Privacy policy
Making the Case Stick
Write down your assumptions, such as cost per ticket and expected churn. Finance teams accept estimates when they can see how you got there. CX Network's Global State of CX 2025 found that nearly 40% of CX professionals named demonstrating ROI as their top obstacle to buy-in. Clear before and after numbers help remove that obstacle.
Share the win
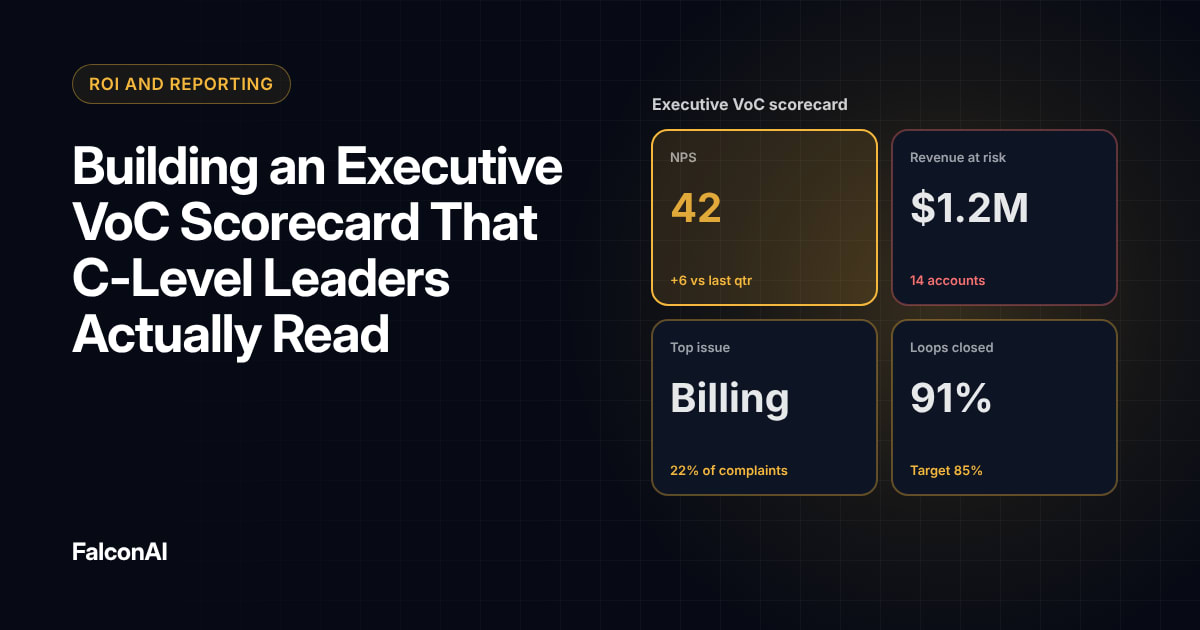
Report the result in your executive VoC scorecard and tell the customers who reported the issue. Each documented win makes the next fix easier to fund. Keep a running list of fixes and their value. Over a year, it becomes the strongest part of your budget case. Our post on proving VoC ROI to the CFO covers how to present it. You can track friction themes in CSAT analysis, or book a demo.
Frequently asked questions
What is a customer friction point?
It's any part of the experience that makes things harder for customers, such as a confusing form or a recurring bug.
How do you measure the cost of friction?
Add the support costs it creates and the revenue lost from customers who leave because of it.
Which friction points should you fix first?
The ones that affect the most customers and revenue, and show up most in churned accounts.
How long should you measure after a fix?
Use the same length of time as your baseline, usually a few months.
What if the impact is hard to isolate?
Compare affected customers with similar customers who didn't hit the issue, and write down your assumptions.
Who should see the results?
Product and finance leaders, plus the customers who reported the problem.