You spent weeks building a VoC dashboard. It has every chart anyone asked for. Three months later, the view count is flat, and people still ask the CX team for screenshots before meetings. You're not alone.
The Adoption Problem Is Common
Analytics tools in general struggle to reach people. Gartner research cited by IBM in 2024 found that on average only 29% of employees use analytics and BI tools.
VoC programs feel this too. Forrester's 2025 State of Feedback Management research found that many CX programs struggle to get stakeholders to act on their insights, and that stakeholder confidence is often low. When adoption is low, the CX team turns into a reporting service. Analysts spend their week pulling screenshots when they could be finding the next problem worth fixing.
Signs your dashboard is unused
Watch for two patterns. Views spike after launch and then fall away. Meanwhile, teams keep asking questions in meetings that the dashboard already answers. If leaders forward screenshots instead of links, that's another sign.
Why People Stop Opening It
Most dashboards show too much. Twenty charts force the reader to work out what matters. Many also live in a separate tool that people have to remember to open.
Workers already lose time to busywork. Slack's 2024 research found that desk workers spend 41% of their time on low-value, repetitive tasks. One more login to check rarely makes the list.
Timing matters as well. A dashboard refreshed monthly tells people about problems they already heard about in a meeting. Feedback that updates daily gives teams a reason to look before the next customer call.
Scores without reasons
A chart that shows NPS fell 4 points doesn't tell anyone what to do. Without the top themes behind the change and an owner for each, the reader closes the tab and moves on. The number becomes something people report upward instead of something they act on.
- 29%Employees who use analytics and BI toolsSource: Gartner research cited by IBM
- 41%Desk workers' time on low-value tasksSource: Slack
Figures as cited in this article
How to Fix It
Build for action. A useful VoC dashboard answers two questions: what changed, and who owns the fix. Here's what to change:
- Cut to one page with the top five themes and their trend.
- Attach an owner to every theme.
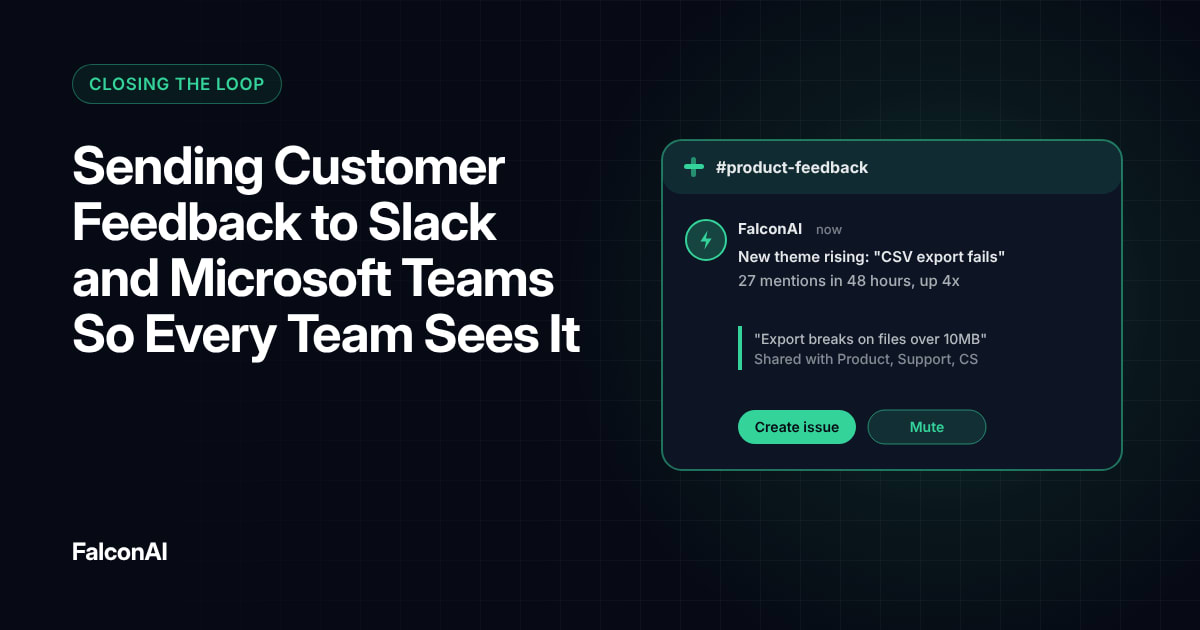
- Push a weekly summary to the channels where people already work.
- Review the dashboard in a standing weekly meeting.
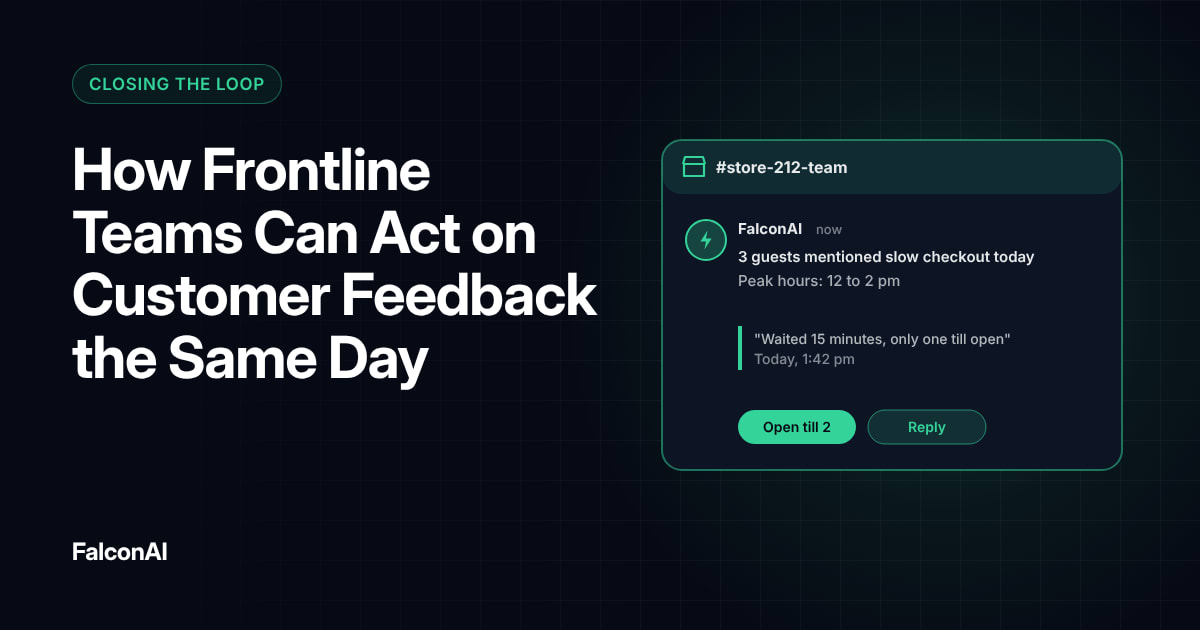
Our guide to sending feedback to Slack and Microsoft Teams shows how to bring the summary to your team.
Build one view per team
Product and support teams care about different themes. Give each team a filtered view of the feedback that affects their work, and leave the company-wide view for leadership. Gartner's Deborah Alvord said VoC leaders should share insight “in different ways that are relevant to their jobs.”
Build for action
The unused dashboard
- Twenty charts
- A separate tool to remember
- Refreshed monthly
- Scores without reasons
The dashboard people use (the approach the article favours)
- One page, top five themes
- An owner for every theme
- Weekly summary where people work
- A standing weekly review
Free review snapshot
See what your customers are saying, before you talk to us.
No commitment. We use your details only to send your snapshot and follow up. Privacy policy
Measuring Whether It Worked
Track weekly active viewers and how many themes get an owner and a fix each month. If both climb, people are using the dashboard. If views rise but fixes don't, the dashboard is informative but not useful, so tighten the ownership step. Read how frontline teams act on feedback. Then build your views in NPS analysis, or book a demo.
Frequently asked questions
Why don't people use VoC dashboards?
Most show too much data and too little direction. People open them when they answer a clear question tied to their job.
What should a VoC dashboard include?
The trend in your main score and the top themes behind it, each with a named owner.
How many charts should a dashboard have?
As few as possible. One page with five to seven views is enough for most teams.
How do you increase dashboard adoption?
Bring the insights to where people work, like Slack or email, and review the dashboard in a regular meeting.
Should each team have its own dashboard?
Yes. Filtered views by team make the feedback relevant to each reader.
How do you measure dashboard success?
Track active viewers and the number of themes that lead to a fix.