Your board looks at net revenue retention every quarter. It probably never looks at your NPS trend. If you want VoC to earn a seat in that meeting, you need to show how customer feedback moves NRR and churn.
What NRR Tells You
Net revenue retention measures how much revenue you keep from existing customers once you count churn and downgrades against expansion. An NRR above 100% means your current customers are growing in value.
SaaS Capital's 2025 retention benchmarks found that companies with NRR of at least 110% grew faster than the median. Those below 100% grew slower. For companies with contracts between $25,000 and $50,000 a year, median NRR was 102%.
Why feedback belongs in the NRR story
Churn and downgrades rarely come out of nowhere. Customers usually complain first, or go quiet. Metrigy research found that 44.4% of customers leave after an average of 2.4 bad experiences. Those bad experiences often show up in your feedback months before they show up in your revenue.
- 110%NRR or higher: companies grew faster than the medianSource: SaaS Capital, 2025
- 102%median NRR for $25,000–$50,000 contractsSource: SaaS Capital, 2025
- 44.4%of customers leave after repeated bad experiencesSource: Metrigy
Figures as cited in this article
How to Link the Two
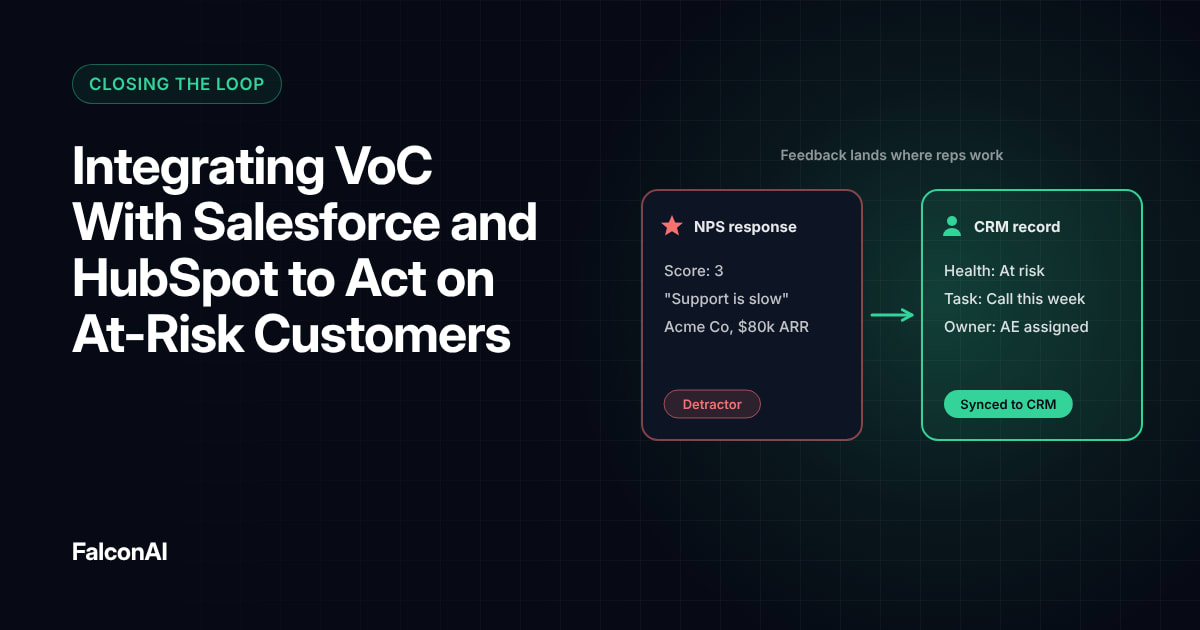
Start by joining feedback data to account data. You need each customer's score and comments next to their revenue and renewal date. Our post on integrating VoC with your CRM covers the setup.
Compare NRR by score group
Split accounts by NPS group and calculate NRR for each one over the past year. In most companies the gap between promoters and detractors is large. That gap is the revenue case for acting on feedback.
Track churn by theme
Look at customers who churned and the themes in their last few comments. If billing complaints show up in a large share of churned accounts, you've found a theme worth fixing first.
Linking feedback to NRR
- Join feedback to account dataScore and comments next to revenue
- Compare NRR by score groupPromoters vs detractors, past year
- Track churn by themeThemes in churned accounts' last comments
Turning the Link Into Action
Once you can see the link, set targets. A drop in detractor share should lead to a rise in NRR over the following quarters. Track both on the same chart so leaders see them move together.
Bain's research on loyalty economics found that promoter attrition averaged about one-third of detractor attrition. Your own data will show your version of that ratio, and it's the number that makes the case.
Use early warnings
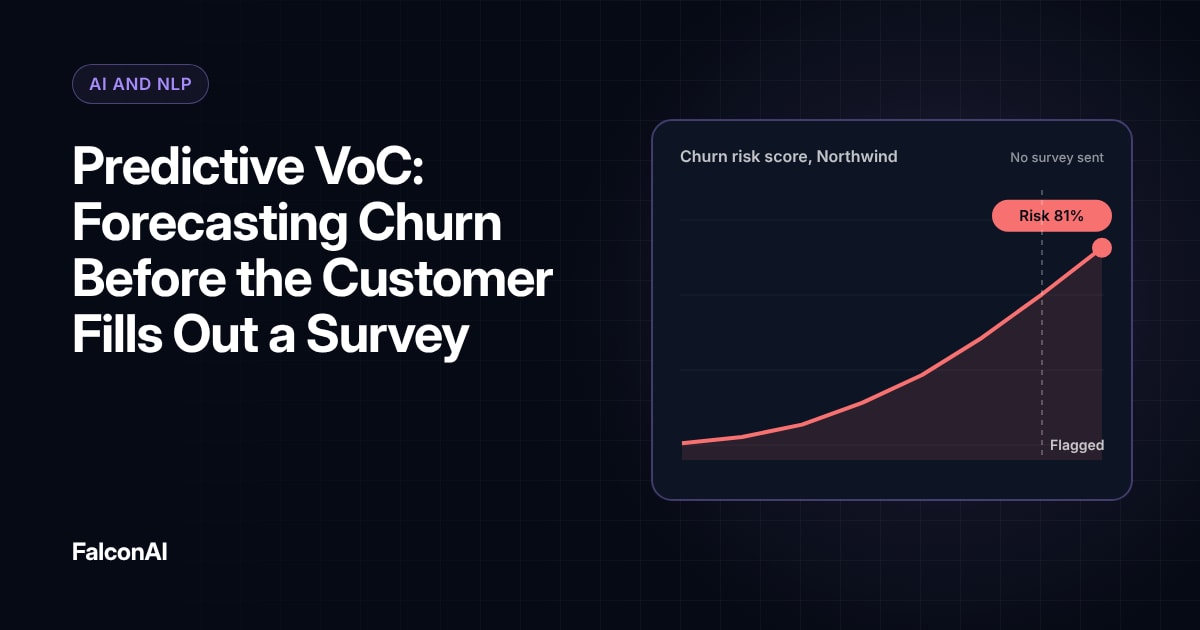
Feedback moves before revenue does. A rising share of negative comments in a segment is a warning that NRR may drop next quarter. Our guide to predictive VoC shows how to turn those signals into churn alerts. Give each alert to the account owner with a clear follow-up date.
Free review snapshot
See what your customers are saying, before you talk to us.
No commitment. We use your details only to send your snapshot and follow up. Privacy policy
Reporting It to Leadership
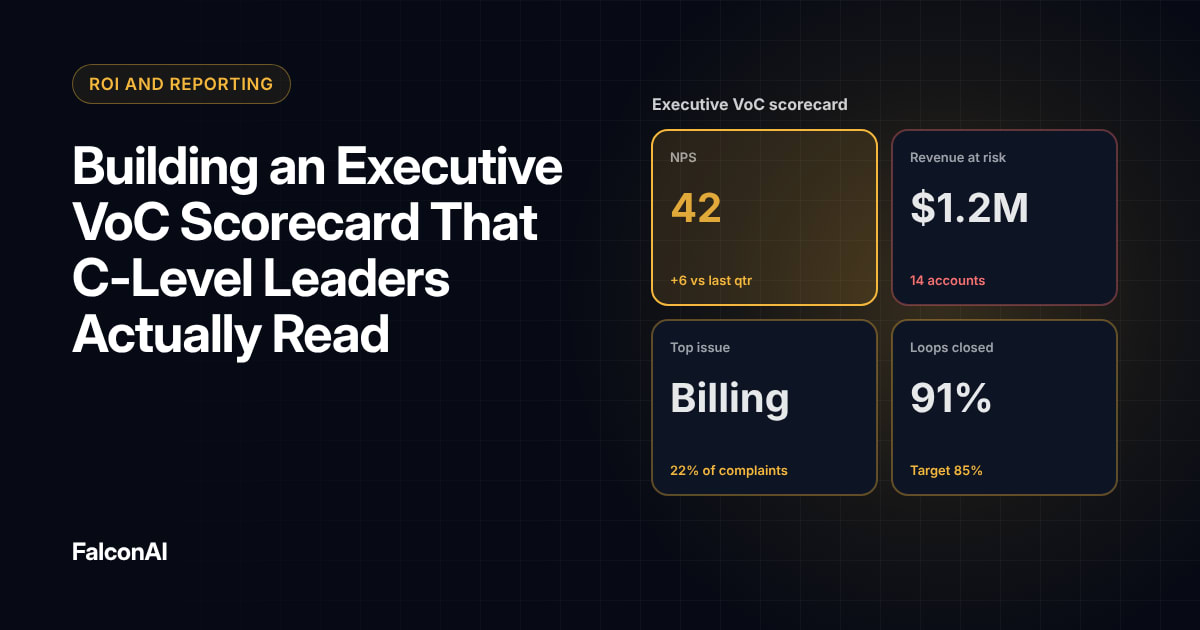
Show NRR by score group in your executive VoC scorecard. Add the top themes linked to churn and the owner of each fix. Keep it to one page so leaders read the whole thing.
Review it every quarter
Update the numbers after each quarter closes. Note which fixes shipped and whether churn on those themes dropped. If a fix didn't move churn, say so and explain what you'll try next. Leaders trust a report that admits misses. You can see retention by score group in NPS analysis, or book a demo to try it with your data.
Frequently asked questions
What is net revenue retention?
NRR is the share of revenue you keep from existing customers over a period, after counting churn and downgrades against expansion.
How does NPS relate to NRR?
Promoters usually renew and expand more, while detractors churn more. Comparing NRR by score group shows the link in your own data.
What is a good NRR?
It depends on contract size. SaaS Capital's 2025 benchmarks put median NRR at 102% for contracts of $25,000 to $50,000 a year.
How do you connect feedback to churn?
Join feedback data to account and renewal data, then compare churn rates by score group and by theme.
Can feedback predict churn?
Yes. Rising negative comments in a segment often show up before revenue drops.
How often should you report VoC and NRR together?
Quarterly works for most companies, with monthly checks on high-risk accounts.